


Executive Summary: Understanding Gas Turbine Pricing in South Africa's Evolving Energy Market
South Africa remains a critical user of gas turbines in Africa, particularly for electricity production, with Eskom operating numerous combustion turbine plants including facilities at Atlantis and Mossel Bay, where Siemens has installed turbines with capacities of 147 MW each. As the nation continues navigating persistent power challenges and working toward its 2039 energy security goals under the Integrated Resource Plan (IRP) 2025, understanding gas turbine pricing becomes essential for mining operators, data center developers, industrial facilities, and utilities seeking reliable baseload and peaking power solutions.
This authoritative guide provides comprehensive pricing data, procurement strategies, and technical specifications for new gas turbines in South Africa's 2025 market—drawing on USP&E Global's 23 years of operational excellence across 35+ countries and current active projects managing 260+ MW in Africa, the Middle East, and beyond.
2025 Gas Turbine Market Overview
The global gas turbine market was valued at $21.5 billion in 2024 and is projected to grow from $22.6 billion in 2025 to reach $34.4 billion by 2033, exhibiting a CAGR of 5.3%. South Africa's position within this expanding market reflects both opportunity and urgency as the country addresses chronic electricity supply constraints while transitioning toward cleaner energy sources.
Key South African Drivers:
- Load-Shedding Mitigation: Persistent electricity gaps drive fast-track power demand
- IRP 2025 Gas Allocation: Government plan includes significant natural gas capacity
- Mining Expansion: Gold, platinum, and battery metals require reliable off-grid power
- Data Center Growth: AI/ML computing infrastructure demands uninterruptible baseload generation
- Cleaner Energy Transition: Natural gas offers lower emissions than coal with dispatchable power
New Gas Turbine Pricing Structure: 2025 South African Market
Equipment-Only Pricing by Capacity
Based on industry benchmarks where equipment-only gas turbine costs range from $1,150/kW for 1-MW power output down to $171/kW for the largest high-efficiency gas turbines with almost 600MW power output, here are current ex-works pricing ranges for South African delivery:
Small-Scale Turbines (1-10 MW)
- Price Range: R18.5-24 million per MW (USD $1,000,000-$1,300,000/MW)
- Total Unit Cost: R20-220 million depending on configuration
- Applications: Remote mining sites, industrial facilities, emergency backup
- Lead Time: 6-12 months from order to delivery
Available Models in USP&E Inventory:
- Solar Taurus T60 (5.6 MW) - New 2025 Model, 50 Hz, 10,500V
- Solar Taurus T70 (7.9 MW) - New 2023 with SoloNOx ultra-low emissions
- Siemens SGT-300 DLE (8.2 MW) - New 2021, 5 units available
Mid-Scale Turbines (10-50 MW)
- Price Range: R11-17 million per MW (USD $600,000-$900,000/MW)
- Total Unit Cost: R120-800 million for complete units
- Applications: Industrial cogeneration, utility peaking, mining operations
- Lead Time: 8-16 months
Key Specifications:
- Solar Titan 130 (15 MW) - Dual fuel (natural gas & diesel), containerized
- GE LM2500G4 DLE (33.3 MW) - Aeroderivative, 50 Hz dual frequency
- Siemens SGT-700 DLE (31.6 MW) - Two units available, proven reliability
Large-Scale Turbines (50-200+ MW)
- Price Range: R5.5-11 million per MW (USD $300,000-$600,000/MW)
- Total Unit Cost: R280 million – R2 billion+ for utility-scale installations
- Lead Time: 12-24 months for new OEM orders, 6-9 months for surplus units
Current USP&E Heavy-Duty Inventory:
- GE Frame 9E PG9171 (126 MW) - 2004/2005 Model, two units available
- Rolls-Royce Trent 60 (77 MW) - New 2016, aeroderivative efficiency
- Siemens V94.2 Combined Cycle (220 MW) - Complete CCPP in excellent condition
Total Installed Cost Analysis: Beyond Equipment Pricing
For combined-cycle gas turbine installations in Africa, benchmark costs including EPC installation range from $0.9-1.3 million per MW, though USP&E's African projects demonstrate real-world costs as low as $0.6-0.9 million per MW through modular designs and local content integration.
Simple-Cycle Gas Turbine Plant (50 MW Example)
Cost Component
Percentage
Estimated Cost (ZAR)
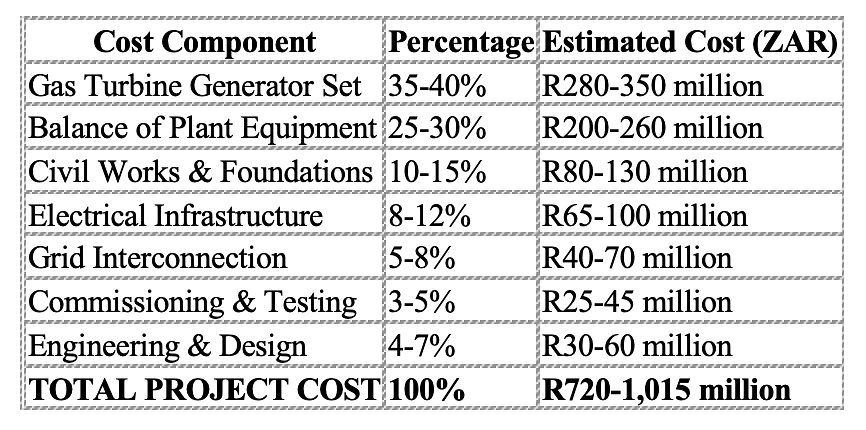
Cost per MW: R14.4-20.3 million/MW (USD $800,000-$1,100,000/MW)
USP&E's Cost Optimization Strategies
As Africa's #1-rated EPC and O&M provider, USP&E delivers 20-35% cost savings through:
- Surplus Equipment Procurement: Access to 3,000+ MW eliminates 18-24 month OEM lead times
- Modular Construction: Containerized solutions reduce on-site construction 40-60%
- Local Content Integration: South African fabrication and assembly where feasible
- Pre-Engineered Systems: Proven designs reduce engineering hours and risks
Factors Affecting Gas Turbine Pricing
1. Technology Selection: Simple-Cycle vs. Combined-Cycle
Simple-Cycle:
- 35-40% thermal efficiency
- 35-45% lower capital cost than CCGT
- 5-15 minute start capability for peaking duty
- Smaller footprint requirements
Combined-Cycle:
- 55-60% thermal efficiency
- Higher capital cost but lower fuel cost per kWh
- Better for baseload continuous operations
- Superior environmental performance
2. Fuel Specification
- Natural Gas Only: Lowest equipment cost, best efficiency, limited flexibility
- Dual-Fuel (Gas + Diesel): 10-15% premium, maximum operational resilience
- Liquid Fuel Only: Higher operating costs, suitable where gas infrastructure absent
Critical Consideration: South Africa's IRP 2025 emphasizes gas-to-power, but high gas utilization may drive up electricity tariffs by 10-15%, making fuel cost optimization essential.
3. Emissions Control Requirements
Modern South African regulations increasingly require:
- Dry Low Emissions (DLE) Combustors: Add 8-12% to turbine cost
- Selective Catalytic Reduction (SCR): R15-30 million for larger units
- NOx Targets: <25 ppm compliance essential
4. Altitude Derating
South African mining operations often occur at elevation:
- Johannesburg/Highveld (1,400-1,800m): 12-18% power derating
- Coastal Regions (Sea Level): Full rated output
Solution: Oversizing equipment or selecting high-altitude-rated turbines—both affect pricing.
New vs. Surplus vs. Used: Price Comparison
New OEM Equipment
- Pricing: 100% baseline reference
- Lead Time: 18-24 months
- Warranty: Full manufacturer coverage (2-5 years)
- Best For: Maximum lifecycle, project finance requirements
New Surplus Equipment (USP&E Specialty)
- Pricing: 60-70% of new OEM cost
- Lead Time: 3-6 months delivery
- Warranty: Transferable manufacturer warranties
- Best For: Fast-track deployment with financing approval
Current Examples:
- Siemens SGT5-2000E (166 MW) - New 2012, never operated
- Ansaldo Energia AE94.2 (488 MW) - New 2017 complete plant
- Multiple Solar Taurus T60/T70 - New 2023-2025 production
Low-Hour Refurbished
- Pricing: 40-60% of new OEM cost
- Lead Time: 4-8 months
- Warranty: Performance guarantees under O&M contracts
- Best For: Budget-conscious projects with proven operational history
Case Study: Mali Gold Mine
Challenge: Remote location, 18-month OEM lead time unacceptable, $75,000/day production losses
USP&E Solution:
- Deployed GE LM2500 aeroderivative from owned inventory
- Dual-fuel (natural gas/diesel) capability
- Complete EPC delivery in 4 months vs. 18+ months
Results:
- 97.3% uptime over 36 months
- Client awarded two additional mine sites
- $13.7 million avoided revenue loss
Project Cost: R14.2 million per MW all-in LSTK
Technical Specifications: Key Selection Criteria
Frequency and Voltage
South African Standard: 50 Hz, typically 11 kV or 22 kV generation
USP&E Inventory: Approximately 65% of current gas turbines are 50 Hz or dual-frequency capable—ideal for South African applications.
Environmental Performance
- NOx Emissions: <25 ppm @ 15% O₂ (DLE technology)
- CO Emissions: <10 ppm
- Noise Levels: <85 dBA at property boundary
Reliability Metrics
- Availability: >98% baseload, >99.5% for critical data center loads
- Hot Start Time: <10 minutes for peaking
- Inspection Intervals: 8,000-24,000 operating hours
- Major Overhaul: 32,000-100,000 hours
USP&E's Competitive Advantages
1. Largest Available Inventory: 3,000+ MW
Unlike brokers or OEMs with long lead times, USP&E maintains:
- 100+ MW Owned Equipment: Purchased outright and warehoused
- 500+ MW Exclusive Rights: Priority access under partnerships
- 2,400+ MW Direct Relationships: Power plant owners and utilities
2. Full EPC + O&M Integration
Assets → Engineering → Construction → Operations
One company, one accountability chain, no finger-pointing when challenges arise.
3. Frontier Market Execution
With 350+ engineers and projects across challenging environments like Mali, Ukraine, and Syria, USP&E thrives where others hesitate:
- FCPA/OFAC compliant operations
- Security-conscious project management
- Local workforce development
- Proven logistics in remote regions
4. Zero Lawsuits in 25 Years
We operate on three principles:
- Extreme Ownership: Our responsibility to fix issues—no excuses
- Speed with Excellence: Quality delivered at velocity
- Radical Integrity: FCPA-compliant, transparent pricing
Procurement Timeline Comparison
Fast-Track Procurement (USP&E In-Stock)
- Month 1-2: Commercial & technical qualification, term sheet
- Month 2-3: Contract & engineering, conceptual design
- Month 3-6: Balance of plant procurement, civil engineering
- Month 6-9: Installation & commissioning, grid interconnection
Total Timeline: 6-9 months from term sheet to commercial operation
Traditional New OEM Procurement
Month 1-6: Selection, contracting, financing Month 6-24: Manufacturing (12-18 months typical) Month 24-36: Construction & commissioning
Total Timeline: 24-36 months
USP&E Speed Advantage: 70-80% faster delivery—critical for mining operations losing $50,000-$200,000 daily without power.
Frequently Asked Questions
Q: Can gas turbines operate at Johannesburg's altitude (1,753 meters)?
A: Yes, but with 15-18% power derating. USP&E accounts for this during equipment sizing—typically oversizing turbines 15-20% to achieve desired output at elevation.
Q: How long does 60 Hz to 50 Hz conversion take?
A: Frequency conversion requires generator/gearbox replacement: 12-18 months and $3-9 million. USP&E maintains significant 50 Hz inventory to avoid these delays.
Q: What is total installed cost for 50 MW plant?
A: Simple-cycle: R720 million – R1.015 billion including all components, grid interconnection, commissioning, and engineering. USP&E typically achieves 20-30% savings vs. competitors.
Q: Do I need environmental permits?
A: Yes. Required permits include:
- Air Emissions License (DFFE)
- Water Use License (if cooling required)
- EIA Authorization (projects >10 MW)
- Eskom Grid Code Compliance
USP&E's EPC services include full permitting support.
Q: Does USP&E provide O&M services?
A: Yes. USP&E operates 260+ MW under active O&M contracts with proven 99%+ availability across challenging African environments.
Recommended Next Steps
For Mining Operations
- Conduct power demand assessment accounting for expansion
- Evaluate fuel options: natural gas pipeline vs. diesel/HFO logistics
- Request USP&E feasibility study (30-60 days, USD $30,000-250,000)
- Review surplus equipment for fast-track opportunities
For Data Center Developers
- Assess Tier III/IV uptime requirements
- Evaluate grid-parallel vs. islanded operation
- Consider dual-fuel systems for maximum reliability
- Request fast-track proposal (90-120 day deployments)
For Utilities and IPPs
- Ensure IRP 2025 alignment
- Structure bankable Power Purchase Agreements
- Complete detailed techno-economic study
- Competitive EPC tender evaluation
Contact USP&E:
📱 WhatsApp: +27 (0)65 744 1119
Industry Resources
Government & Industry References (rel="nofollow"):
- U.S. Energy Information Administration - International Energy Statistics - Authoritative global energy data and market analysis
- International Energy Agency - World Energy Outlook - Comprehensive energy trends and forecasts
- U.S. Department of Energy - Gas Turbine Research - Technical standards and efficiency guidelines
Conclusion
As South Africa navigates immediate power constraints while transitioning toward cleaner energy, natural gas turbines represent a critical bridge technology. New gas turbine pricing ranges from R5.5-24 million per MW depending on capacity, with total installed costs typically 2-3x equipment-only pricing.
Key Takeaways:
- Surplus equipment offers 30-60% savings vs. new OEM orders
- Project timelines: 6-9 months (USP&E) vs. 24-36 months (traditional)
- Combined-cycle delivers 55-60% efficiency vs. 35-40% simple-cycle
- O&M quality determines long-term success—USP&E's 99%+ availability proven
With 350+ engineers, 260+ MW under management, and zero lawsuits in 25 years, USP&E combines entrepreneurial speed with engineering credibility—delivering lifecycle power solutions backed by extreme ownership and radical integrity.
Harnessing Energy for Life
Powering Possibility. Built for the Frontier.