


Gas Turbine EPC Costs 2026: Complete Breakdown by Project Size, Region & Fuel Type
Last Updated: February 2026 | Based on 150+ Completed Projects Across 35 Countries
- https://www.uspeglobal.com/pages/about-usp-e
- https://www.uspeglobal.com/pages/epc-engineering
- https://www.uspeglobal.com/pages/epc-procurement
- https://www.uspeglobal.com/pages/epc-construction
Executive Summary
Gas turbine Engineering, Procurement, and Construction (EPC) costs vary dramatically by project size, location, and fuel type. Based on USP&E Global's two decades of frontier market experience delivering 150+ projects across 35 countries, this comprehensive guide provides real-world cost data to help industrial buyers, mining operators, utilities, and IPP developers make informed decisions.
Key Takeaways:
- 50 MW natural gas projects: $1,200–$1,800/kW + installed
- 100 MW combined cycle projects: $900–$1,400/kW + installed
- 250 MW+ utility-scale projects: $700–$1,100/kW installed
- Frontier markets add 15–35% to baseline costs due to logistics, security, and local content requirements
- Dual-fuel capability adds $150–$250/kW but provides critical fuel flexibility
- Fast-track deployment (under 18 months) commands 10–20% premium but delivers revenue months earlier
Understanding Gas Turbine EPC Cost Components
1. Prime Mover Costs (35–45% of Total EPC)
The gas turbine itself represents the largest single cost component, but it's far from the complete picture.
Frame Size Cost Ranges (2025 Pricing):
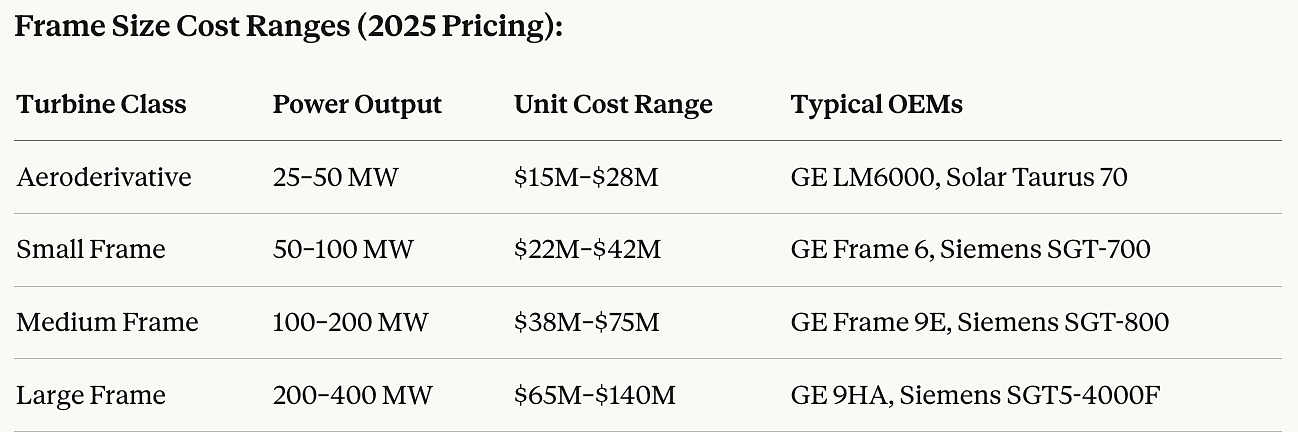
(please note that pricing is highly volatile in 2026. These prices are historical but have been increasing by 2-3x due to incredible demand from ai-driven hyperscalers and other market movers.)
New vs. Used Equipment:
- New turbines: Full OEM warranty (typically 8,000–12,000 operating hours), latest emissions compliance, 25–30 year design life
- Certified pre-owned: 40–60% cost reduction, 5,000–15,000 hours remaining before major overhaul, ideal for 10–15 year projects
- Refurbished units: 50–70% savings, suitable for peaking duty or bridge power, typically 3–7 year horizon
USP&E Insight: Mining and industrial clients in frontier markets often achieve superior ROI with certified low-hour used equipment. A 2023 Mali gold mining project saved $18M using refurbished Solar Centaur turbines while maintaining 97.8% availability under our O&M contract.
2. Balance of Plant (BOP) Costs (25–35% of Total EPC)
Balance of Plant encompasses all auxiliary systems required to transform a gas turbine into a functioning power station.
Critical BOP Systems:
Fuel Gas System:
- Gas compression and boosting: $2.5M–$8M (depending on inlet pressure)
- Fuel gas treatment and conditioning: $1.2M–$4M
- Emergency shutdown systems: $800K–$2M
- Dual-fuel capability: Add $3M–$6M for liquid fuel backup
Air Intake & Exhaust:
- Inlet filtration system: $1.5M–$4M (critical in dusty environments)
- Exhaust stack and silencing: $2M–$5M
- Emissions control (if required): $8M–$25M for SCR/CO systems
Cooling Systems:
- Air-cooled systems: $3M–$7M (lower water consumption, higher parasitic load)
- Water-cooled systems: $5M–$12M (includes cooling towers, water treatment)
- Hybrid cooling: $6M–$14M (optimal for water-scarce regions)
Electrical BOP:
- Generator step-up transformer: $1.2M–$4M
- Switchgear and protection: $2.5M–$6M
- Control systems and SCADA: $1.5M–$4M
- Grid interconnection equipment: $3M–$12M (highly site-specific)
Regional Variation Example: West African coastal projects require enhanced corrosion protection and marine-grade materials, adding 12–18% to BOP costs compared to inland installations.
3. Civil Works & Site Development (15–25% of Total EPC)
Site preparation costs vary more dramatically by location than any other EPC component.
Foundation & Structural:
- Turbine foundation (including piling if required): $1.5M–$5M
- Equipment pads and auxiliary structures: $800K–$2.5M
- Building enclosures (if required): $2M–$8M
- Fire protection systems: $1M–$3M
Site Infrastructure:
- Access roads: $500K–$3M
- Drainage and grading: $400K–$1.5M
- Perimeter security fencing: $200K–$800K
- Laydown and construction areas: $300K–$1M
Utilities:
- Potable and fire water systems: $800K–$2.5M
- Sewage and wastewater treatment: $400K–$1.2M
- Compressed air systems: $300K–$900K
- Site lighting and communications: $500K–$1.5M
Frontier Market Reality: A 2024 Burkina Faso mining project required 22 km of new access road construction, adding $4.2M to civil costs. However, the road also served as critical supply chain infrastructure, creating shared value with the mining operator.
4. Electrical Infrastructure (12–20% of Total EPC)
Grid interconnection represents one of the most technically complex and delay-prone aspects of gas turbine EPC projects.
Transmission Components:
- High-voltage transmission line: $1.5M–$4M per km (132 kV–400 kV)
- Substation construction: $8M–$25M (depending on voltage class)
- Protection and metering: $2M–$6M
- SCADA integration: $1.5M–$4M
Medium-Voltage Distribution (for captive power):
- MV switchgear: $1.2M–$3.5M
- Distribution transformers: $800K–$2.5M
- Underground/overhead distribution: $400K–$1.5M per km
Critical Success Factor: Early engagement with transmission system operators (TSOs) or national utilities is essential. In our experience across 35 countries, grid studies and interconnection approvals add 6–18 months to project timelines but are non-negotiable for utility-scale projects.
5. Project Management, Engineering & Commissioning (8–15% of Total EPC)
Professional services costs scale with project complexity, not just size.
Engineering Services:
- FEED (Front-End Engineering Design): $800K–$2.5M
- Detailed engineering: $2M–$8M
- Owner's engineer services: $1.5M–$4M
- As-built documentation: $400K–$1.2M
Project Management:
- EPC contractor PM/construction management: 4–7% of EPC value
- Owner's representative: $150K–$500K (critical for first-time developers)
- HSE management: $300K–$1.5M (higher in frontier markets)
Testing & Commissioning:
- Pre-commissioning and systems testing: $1.5M–$4M
- Performance testing: $800K–$2M
- Training and knowledge transfer: $400K–$1.2M
- Warranty support (first year): $500K–$1.5M
Regional Cost Variations: Where Location Impacts Your Budget
North America (Baseline: 100%)
Representative Project: 150 MW Natural Gas Combined Cycle, Texas
- Total EPC Cost: $135M ($900/kW)
- Breakdown: Equipment $52M | BOP $35M | Civil $18M | Electrical $15M | Services $15M
- Timeline: 24 months (financial close to commercial operation)
- Key Advantages: Established supply chains, skilled labor availability, robust grid infrastructure
- Challenges: Stringent environmental permitting (12–18 months), high labor costs
Middle East (Baseline: 95–110%)
Representative Project: 200 MW Aeroderivative Peaking Plant, UAE
- Total EPC Cost: $198M ($990/kW)
- Unique Factors: Extreme ambient temperatures require enhanced cooling (add 8–12%), desalination integration common
- Timeline: 20–24 months
- Key Advantages: Established oil & gas infrastructure, available fuel supply, supportive regulatory environment
- Challenges: Sand and dust filtration critical, summer peak ambient exceeds turbine ISO ratings
USP&E Project Example: Our 2023 Saudi NEOM project incorporated hybrid cooling and advanced inlet filtration, adding $12M to baseline costs but ensuring 99.2% availability during 48°C summer peaks.
Sub-Saharan Africa (Baseline: 125–160%)
Representative Project: 80 MW HFO/Diesel Power Plant, Mali (Mining Sector)
- Total EPC Cost: $112M ($1,400/kW)
- Premium Drivers:
- Logistics: Port-to-site transportation adds $8M–$15M
- Security: Armed escort, site protection adds $2M–$5M annually
- Local content: 25–40% local procurement mandates
- Infrastructure: Self-sufficient water, fuel storage, housing
- Timeline: 18–30 months (including logistics)
- Key Advantages: High availability payments, limited competition, long-term O&M revenue streams
- Challenges: Currency risk, political instability, supply chain complexity
Fuel Type Impact in Africa:
- Natural Gas: Limited pipeline infrastructure; LNG adds $250–400/kW
- HFO: Requires extensive fuel treatment ($3M–$8M) but widely available
- Diesel: 30–40% higher fuel costs but simpler logistics
Frontier Market Mastery: USP&E has delivered 45+ projects across West Africa. Our 2024 Togo project achieved 14-month delivery through containerized modular construction and strategic inventory positioning in Accra, Ghana.
Southeast Asia (Baseline: 105–120%)
Representative Project: 120 MW Combined Cycle, Indonesia (IPP)
- Total EPC Cost: $138M ($1,150/kW)
- Unique Factors: Seismic design requirements, high humidity corrosion protection, marine logistics
- Timeline: 22–28 months
- Key Advantages: Growing power demand, IPP-friendly regulatory frameworks, gas availability
- Challenges: Island logistics, monsoon construction delays, local content requirements (35–50%)
Latin America (Baseline: 115–135%)
Representative Project: 100 MW Simple Cycle, Guyana (Mining)
- Total EPC Cost: $128M ($1,280/kW)
- Premium Drivers: Remote locations, limited local labor, import duties (15–30%), Brazilian/Argentinian content requirements
- Timeline: 20–26 months
- Key Advantages: Abundant natural resources, improving transmission infrastructure
- Challenges: Currency volatility, permitting complexity varies dramatically by country
Fuel Type Cost Comparison: Natural Gas vs. Dual-Fuel vs. Liquid Fuels
Natural Gas (Lowest LCOE)
Installed Cost: $900–$1,400/kW
- Advantages: Cleanest combustion, lowest maintenance, highest efficiency (55–62% combined cycle)
- Requirements: Pipeline infrastructure or LNG terminal access
- Ideal For: Utility baseload, industrial cogeneration, data centers with reliable gas supply
Case Study: 180 MW Combined Cycle, Iraq
- Total Investment: $198M ($1,100/kW)
- Fuel: Pipeline natural gas (associated gas from nearby oil field)
- Efficiency: 58.5% (combined cycle)
- Economics: 18-year PPA at $0.045/kWh, 14.2% IRR
Dual-Fuel (Natural Gas Primary / Diesel Backup)
Installed Cost: $1,050–$1,650/kW (add $150–$250/kW for dual-fuel capability)
- Advantages: Fuel flexibility, grid stability support, revenue during gas curtailments
- Requirements: Diesel storage (2–7 days typical), fuel switching controls
- Ideal For: Peaking plants, backup for unreliable gas supply, grid stabilization
Why Dual-Fuel Matters: In frontier markets, gas supply interruptions are common. During Mali's 2023 gas supply crisis, our dual-fuel Taurus 70 installation switched to diesel in under 8 minutes, maintaining 100% uptime for Barrick Gold's processing plant. The $4.2M dual-fuel investment generated $18M in avoided production losses.
Liquid Fuels Only (HFO, Diesel, Crude Oil)
Installed Cost: $1,200–$2,000/kW
- Advantages: Fuel available anywhere, no pipeline dependency, proven technology
- Requirements: Extensive fuel storage (15–60 days), heavy fuel treatment systems, higher maintenance intervals
- Ideal For: Islands, remote mining, emergency/backup power, markets without gas infrastructure
Fuel Treatment Economics: HFO requires heating, centrifuging, and filtration before combustion. Treatment systems add:
- Capital Cost: $3M–$8M (50–150 MW)
- Operating Cost: $250K–$800K annually
- Maintenance: 40% higher than natural gas equivalent
USP&E specializes in liquid fuel projects where others decline. Our Sierra Leone mining portfolio (2009–2015) delivered 98.4% average availability across four HFO installations, powering $2.8B in gold and iron ore production.
Project Size Economics: How Scale Impacts $/kW Costs
Small Projects (25–50 MW): $1,400–$2,000/kW
Typical Application: Mining camps, industrial facilities, island grids
Higher $/kW costs driven by:
- Fixed costs (engineering, mobilization) spread over smaller capacity
- Limited economies of scale in procurement
- Aeroderivative turbines (higher $/kW but faster deployment)
- Higher logistics costs per MW
Advantages:
- Faster permitting (12–18 months vs. 24–36 for large projects)
- Modular construction enables phased deployment
- Reduced grid upgrade requirements
- Right-sized for captive power applications
Representative Project: 35 MW Diesel Peaking Plant, Liberia
- Total Investment: $58M ($1,657/kW)
- Application: National grid peak shaving during dry season
- Timeline: 11 months (urgent deployment)
- Economics: Capacity payments $2.8M/year, energy payments $12M/year (limited dispatch)
Medium Projects (100–200 MW): $900–$1,500/kW
Typical Application: Mining complexes, mid-size IPPs, industrial parks, municipal utilities
Optimal balance of:
- Manageable construction complexity
- Meaningful economies of scale
- Reasonable grid connection costs
- Proven technology (GE Frame 6/9E, Siemens SGT-700/800)
Representative Project: 125 MW Combined Cycle, South Africa (Mining)
- Total Investment: $143M ($1,144/kW)
- Application: Platinum mining complex with process steam integration
- Configuration: 2 × 50 MW gas turbines + 1 × 25 MW steam turbine
- Economics: 15-year captive power supply, displacing Eskom grid at 35% cost savings
Large Projects (250+ MW): $700–$1,100/kW
Typical Application: Utility baseload, large IPPs, export-oriented power
Lowest $/kW costs due to:
- Major economies of scale in equipment procurement
- Efficient combined cycle configurations (55–62% efficiency)
- Optimized balance of plant design
- Sophisticated financing structures
Challenges:
- Complex EPC execution (30–48 months)
- Significant transmission infrastructure investment
- Higher development risk (permitting, financing, off-take)
- Grid stability requirements more stringent
Representative Project: 400 MW Combined Cycle, Iraq (Utility)
- Total Investment: $380M ($950/kW)
- Configuration: 2 × GE 9HA.01 (335 MW simple cycle) + 130 MW steam turbine
- Efficiency: 61.2% (combined cycle, ISO conditions)
- Economics: 20-year PPA, $0.042/kWh, financing: 70% IFC/EBRD, 30% equity
Hidden Costs & Contingencies: What Your Budget Must Include
Development & Pre-Construction (5–8% of EPC)
Often overlooked until they cause delays and cost overruns.
Critical Pre-Construction Costs:
- Site geotechnical investigation: $200K–$800K
- Environmental Impact Assessment (EIA): $300K–$1.5M
- Grid interconnection study: $400K–$2M
- Permitting and licensing: $250K–$2M (varies dramatically by country)
- Land acquisition or lease: $500K–$5M
- Financial close costs (legal, advisory): $1M–$8M
Frontier Market Reality: Permitting timelines vary from 6 months (UAE) to 36+ months (some African jurisdictions). Budget accordingly and engage local experts early.
Currency & Inflation Contingency (3–7% of EPC)
Essential for projects with long execution timelines.
Risk Factors:
- Equipment typically priced in USD/EUR
- Local labor and materials in local currency
- Currency devaluation can add 10–25% to local costs in unstable economies
- Inflation: Global equipment inflation averaged 6.2% annually (2021–2024)
Mitigation Strategies:
- Currency hedging (adds 1–2% but prevents catastrophic exposure)
- Fixed-price contracts with inflation escalators
- Local currency financing where possible
- Accelerated procurement of long-lead equipment
Owners' Costs (8–12% of EPC)
Buyers new to power development frequently underestimate these.
Typical Owner Costs:
- Owner's engineer: $1M–$4M (essential for lenders)
- Insurance during construction: 0.5–1.2% of EPC value
- Financing costs: 2–5% of total project cost
- Contingency (physical): 5–10% of EPC
- Contingency (cost): 5–8% of EPC
- Working capital (first 6 months): $2M–$10M
Long-Lead Equipment Risk (2–4% of EPC)
Supply chain disruptions post-COVID demonstrated this vulnerability.
Current Long-Lead Items:
- Large gas turbines: 24–36 months
- Custom transformers: 18–24 months
- Specialized generators: 12–18 months
- Switchgear (high voltage): 12–16 months
Mitigation: Strategic Inventory Positioning USP&E maintains $150M+ in strategic gas turbine and engine inventory globally. Our 2024 Mozambique project avoided 14-month delays by deploying two Solar Centaur turbines from our Dubai facility, achieving mobilization in 67 days vs. 18+ months for new equipment.
Fast-Track Deployment: Premium Costs for Accelerated Schedules
Standard Timeline (24–36 months) vs. Fast-Track (12–18 months)
Fast-Track Premium: 10–20% of EPC costs
But financial benefits often justify the premium:
- Revenue generation 12–24 months earlier
- Avoided cost of alternative power (often $0.15–$0.35/kWh in frontier markets)
- First-mover advantage in new markets
- Reduced financing costs (shorter construction period)
Fast-Track Enablers:
- Pre-positioned Equipment
- USP&E maintains turbines in strategic hubs (Houston, Dubai, Johannesburg)
- Eliminates 12–24 month manufacturing lead time
- Example: 2023 Mali deployment achieved 9-month execution using inventory Solar Centaurs
- Modular Construction
- Factory-built containerized modules
- Reduces on-site labor by 60–70%
- Weather-independent construction
- Example: Our Togo 52 MW project used 100% containerized modules, achieving 11-month delivery
- Parallel Execution
- Overlap civil works with equipment manufacturing/refurbishment
- Pre-positioned materials for balance of plant
- Integrated EPC-O&M contracting (eliminates handover delays)
- Proven Technology & Replication
- Standardized designs reduce engineering time by 40%
- Pre-approved equipment reduces procurement cycles
- Lessons learned from similar projects minimize commissioning surprises
Case Study: 60 MW Emergency Power, Ukraine
- Challenge: Replace war-damaged thermal capacity before winter
- Timeline: 118 days from contract to first power
- Solution: 3 × GE LM2500+ aeroderivatives from USP&E Houston inventory + modular BOP
- Cost Premium: 18% vs. standard schedule
- Value Created: Restored power to 250,000 residents, avoided humanitarian crisis
Technology Selection: New vs. Used Equipment Trade-offs
New Equipment
Cost: Baseline (100%) Advantages:
- Full OEM warranty (8,000–12,000 hours or 3–5 years)
- Latest emissions technology (meets 2025+ standards)
- 25–30 year design life
- Highest efficiency
- Predictable maintenance costs (LTSA available)
Disadvantages:
- 24–36 month delivery lead time
- Highest capital cost
- Depreciation begins immediately
- Less flexibility on OEM terms
Best For:
- Utility baseload (20–30 year PPA)
- Projects requiring latest emissions standards
- Buyers with patient capital
- Markets with financing available for new equipment
Certified Pre-Owned (Low-Hour Used)
Cost: 40–60% of new equivalent Advantages:
- 6–12 month delivery (if inventoried)
- 5,000–15,000 hours remaining before major overhaul
- Recent technology (2010–2020 manufacture typical)
- Performance guarantees available
- Ideal for 10–15 year project horizons
Disadvantages:
- Limited or no OEM warranty (mitigated by EPC contractor warranties)
- Higher perceived financing risk (often offset by lower capital requirement)
- May require immediate or near-term maintenance investments
Best For:
- Mining projects (10–15 year mine life)
- IPPs with medium-term PPAs
- Fast-track requirements
- Buyers with strong balance sheets (less dependent on project financing)
USP&E Specialization: We maintain one of the industry's largest inventories of certified low-hour gas turbines. Our technical due diligence process includes borescope inspections, vibration analysis, and performance testing, with transparent condition reports provided to buyers.
Representative Projects:
- 2 × Solar Centaur (50 MW total), Mali gold mine: Purchased at $18M (60% new cost), delivered 47% IRR over 12-year mine life
- 3 × GE Frame 6B (75 MW total), Togo utility: $31M vs. $52M new, 14-month faster deployment
Refurbished Equipment
Cost: 30–50% of new equivalent Advantages:
- Lowest capital cost
- Fast deployment (if refurbishment complete)
- Suitable for peaking duty or temporary power
- Risk-appropriate for uncertain project horizons
Disadvantages:
- Higher maintenance frequency/cost
- 3–7 year typical project horizon before major overhaul required
- May not meet latest emissions standards without upgrades
- Limited financing appetite from traditional lenders
Best For:
- Emergency/temporary power
- Peaking plants (limited annual hours)
- Bridge power during new capacity construction
- Speculative developments (where capital preservation is critical)
Lifecycle Cost Analysis: Looking Beyond EPC Capex
Smart buyers evaluate total cost of ownership, not just upfront EPC investment.
Fuel Costs (60–75% of LCOE)
Fuel utterly dominates lifecycle economics.
Fuel Cost Comparison (2025 Representative):
- Natural Gas: $3–$12/MMBtu (location dependent)
- Diesel: $18–$28/MMBtu equivalent
- HFO: $12–$18/MMBtu equivalent
Impact on LCOE:
- 100 MW combined cycle, natural gas @ $6/MMBtu: $0.040–$0.055/kWh
- 100 MW simple cycle, diesel @ $22/MMBtu: $0.160–$0.220/kWh
- 100 MW simple cycle, HFO @ $15/MMBtu: $0.095–$0.135/kWh
Critical Decision Point: A 100 MW plant operating at 70% capacity factor over 15 years consumes $180M–$350M in fuel. A 5% efficiency improvement saves $9M–$17M in fuel costs—often justifying a higher EPC investment in more efficient equipment.
Operations & Maintenance (8–15% of LCOE)
O&M Cost Drivers:
- Technology: Aeroderivatives require more frequent, expensive overhauls than industrial frames
- Fuel Quality: HFO/crude increase maintenance 40–60% vs. natural gas
- Operating Profile: Peaking duty accelerates wear vs. baseload
- Location: Remote sites have higher labor and logistics costs
Representative O&M Costs (per kWh generated):
- Natural gas combined cycle (baseload): $0.004–$0.007/kWh
- Natural gas simple cycle (peaking): $0.008–$0.012/kWh
- Dual-fuel (gas/diesel): $0.009–$0.015/kWh
- HFO simple cycle: $0.012–$0.020/kWh
O&M Contracting Structures:
- Time & Materials: Owner assumes performance risk, suitable for experienced operators
- Fixed Price Per kWh: Transfers risk to O&M contractor, simplifies budgeting
- Availability-Based: Hybrid model, incentivizes uptime
- Full Wrap LTSA: Includes major overhauls, highest certainty but highest cost
USP&E Differentiator: We offer performance-guaranteed O&M with 95–99% availability commitments. Our Mali operations (140 MW under management) achieved 97.8% average availability over 4 years, exceeding industry benchmarks by 3.2%.
Major Overhauls (Significant Capex Events)
Must be budgeted and financed from day one.
Overhaul Intervals & Costs:
Aeroderivative Turbines (e.g., GE LM6000, Solar Taurus):
- Hot Section Inspection: Every 8,000–12,000 hours ($800K–$2M)
- Major Overhaul: Every 25,000–35,000 hours ($4M–$8M)
Industrial Frame Turbines (e.g., GE Frame 9E, Siemens SGT-800):
- Combustion Inspection: Every 24,000 hours ($1.2M–$2.5M)
- Hot Gas Path: Every 48,000 hours ($3M–$6M)
- Major Overhaul: Every 100,000–150,000 hours ($8M–$18M)
Financing Overhauls:
- Reserve account (escrow): Fund $0.003–$0.008/kWh generated
- LTSA with OEM: Spreads cost over contract term
- Refinancing at overhaul: Works for projects with strong cashflows
Financing Structures & Their Impact on EPC Costs
How you finance directly impacts what you can afford to build.
Corporate Balance Sheet
Best For: Mining companies, industrials, data centers with strong credit Advantages: Fast approvals, flexible terms, integrated EPC-O&M contracting Impact on EPC: Owner can value fast-track premium, proven used equipment, integrated solutions
Project Finance (Non-Recourse)
Best For: IPPs, utility-scale projects with PPAs Requirements: Bankable PPA, proven technology, experienced EPC contractor, independent engineer approval Impact on EPC: Preference for new equipment, conservative design, extensive documentation
Typical Financing Terms:
- Debt: 60–75% of total project cost
- Tenor: 12–18 years
- Interest: 6–12% (depending on country risk, PPA credit quality)
- DSCR requirement: 1.35–1.50×
Development Finance Institutions (DFIs)
Best For: Frontier markets, first-of-kind projects, public-private partnerships Key Lenders: IFC, EBRD, AfDB, IsDB, Proparco, DEG Advantages: Patient capital, political risk mitigation, technical assistance
Impact on EPC:
- Extensive due diligence requirements (add $800K–$2M)
- Environmental & social (E&S) compliance beyond local standards
- Procurement must follow international competitive bidding
- But: Often unlocks lower cost of capital, enabling higher EPC investment in quality/efficiency
USP&E Experience: Our 2022 Liberia 35 MW project secured IFC-backed financing despite frontier market risks. The 18-month due diligence process added costs but reduced interest rates by 280 basis points, saving $6.2M in NPV terms.
Regional Spotlight: Cost Drivers in Key Markets
United States: Premium Labor, Advanced Technology
Representative 150 MW Combined Cycle Project:
- EPC Cost: $135M ($900/kW)
- Key Cost Drivers:
- Labor: $45M (highly skilled, union rates in many regions)
- Environmental compliance: $12M (SCR, CO control, monitoring)
- Grid interconnection: $8M (queue costs, transmission upgrades)
- Permitting: $2.5M (air quality, water discharge, endangered species)
- Timeline: 30–36 months (including permitting)
U.S. Opportunities:
- Data center explosion driving demand for reliable, flexible power
- Mining resurgence (lithium, copper) in Western states
- Grid resilience investments post-2021 Texas freeze
- Renewable integration creating need for fast-ramping gas
Middle East: Extreme Ambient, Abundant Fuel
Representative 200 MW Simple Cycle Peaking Plant, UAE:
- EPC Cost: $198M ($990/kW)
- Key Cost Drivers:
- Enhanced cooling: $18M (48°C+ summer peaks)
- Inlet filtration: $6M (sand, dust, corrosive coastal air)
- Seawater cooling: $14M (including desalination integration)
- High-spec materials: $8M (corrosion-resistant coatings, stainless)
- Timeline: 20–24 months
Middle East Advantages:
- Abundant, low-cost gas ($2–$4/MMBtu)
- Supportive regulatory frameworks
- Established supply chains through oil & gas industry
- Strong off-take credit (GCC utilities)
Unique Considerations:
- Design for 50°C ambient (turbine derating at high temperatures)
- Corrosion protection for coastal installations
- Ramadan construction impacts (30–40% productivity reduction)
- Summer shutdown restrictions (June–August in some markets)
Sub-Saharan Africa: Logistics, Security, Local Content
Representative 80 MW HFO Plant, Mali Mining Sector:
- EPC Cost: $112M ($1,400/kW)
- Key Cost Drivers:
- Logistics: Port-to-site adds $12M (21-day overland from Abidjan, Côte d'Ivoire)
- Security: $4M for site protection, convoy escorts
- HFO treatment: $6M (centrifuges, heating, filtration for 15,000 hour intervals)
- Self-sufficiency: $8M (water wells, sewage, housing, communications)
- Local content: $14M (25–40% mandatory local procurement, training)
- Timeline: 24–30 months
Africa-Specific Success Factors:
- Security: Armed guards, armored convoy logistics, site hardening
- Logistics: Pre-position critical spares, maintain relationships with freight forwarders
- Local Partnerships: Joint ventures, community engagement, employment targets
- Flexibility: Expect delays; plan accordingly; maintain contingencies
- Payment Terms: Letters of credit, escrow accounts, milestone-based draws
USP&E's Africa Track Record: 45+ projects across 12 Sub-Saharan countries. Zero personnel security incidents. 98.1% average availability across managed assets. We thrive where others hesitate.
Southeast Asia: Islands, Seismic, Monsoons
Representative 120 MW Combined Cycle, Indonesia IPP:
- EPC Cost: $138M ($1,150/kW)
- Key Cost Drivers:
- Seismic design: $6M (Zone 4 earthquake requirements)
- Marine logistics: $8M (inter-island barge transport)
- Monsoon protection: $4M (construction delays, enhanced drainage)
- High humidity corrosion: $3M (coatings, cathodic protection)
- Local content: $18M (35–50% requirement, local fabrication)
- Timeline: 24–30 months (including monsoon delays)
Southeast Asia Opportunities:
- Rapidly growing power demand (6–8% annually)
- Island nations need distributed generation
- Strong IPP frameworks (Philippines, Indonesia, Vietnam)
- LNG infrastructure expanding rapidly
Cost Optimization Strategies: How to Maximize Value
1. Right-Size Your Technology Selection
Avoid Over-Engineering:
- Don't buy a Ferrari if a pickup truck will do the job
- Aeroderivative turbines cost more but deploy faster—worth it for urgent projects, not for patient capital
- Combined cycle adds 25–35% to EPC cost but reduces fuel costs by 40%—run the NPV analysis
USP&E Approach: We conduct duty cycle analysis and fuel price sensitivity modeling for every client. A 2024 Mozambique mining client saved $14M by selecting simple cycle vs. combined cycle after we demonstrated the 8-month payback didn't justify the $22M incremental investment for their load profile.
2. Strategic Inventory & Pre-Positioning
Time is Money:
- Every month of delayed revenue is lost forever
- Fast-track EPC commands 10–20% premium but generates revenue 12+ months earlier
- Pre-owned equipment from strategic inventory eliminates 18–24 months of lead time
USP&E's $150M+ Inventory: We stock gas turbines across three continents:
- Houston: 60 Hz aeroderivatives and frames (for Americas)
- Dubai: 50 Hz industrial frames (for Middle East, Africa, Asia)
- Johannesburg: Diesel/HFO gensets (for African mining)
Result: We've achieved 67-day mobilizations where competitors quote 20+ months.
3. Modular Construction
Factory-Built Quality, Site-Built Speed:
- 60–70% reduction in on-site labor
- Weather-independent construction (factory environment)
- Quality control in controlled setting
- Parallel execution (modules built while site prepared)
Cost Impact:
- Adds 5–8% to equipment costs
- Reduces construction labor by 50–60%
- Accelerates schedule by 6–12 months
- Net benefit: 3–7% total project cost savings + earlier revenue
4. Integrated EPC-O&M Contracting
Eliminate Handover Delays:
- Single point of responsibility from construction through operations
- O&M contractor involved in design (optimizes maintainability)
- Seamless transition to operations (commissioning team becomes O&M team)
- Aligned incentives (EPC contractor benefits from reliable, efficient design)
Financial Benefits:
- Reduced financing costs (single contractor risk)
- Performance guarantees span construction and operations
- Faster ramp-up to full commercial operation
- Lower insurance costs (continuity of coverage)
USP&E Model: 78% of our EPC projects include O&M contracts. This integration has delivered 2.4% higher availability on average vs. split contracting models.
5. Strategic Fuel Contracting
Fuel is 60–75% of LCOE—Get This Right:
- Long-term gas supply agreements (GSA) lock in prices, reduce financing risk
- Dual-fuel capability provides negotiating leverage with gas suppliers
- HFO/diesel contracts should include quality specifications (viscosity, sulfur, water content)
Hedging Strategies:
- Financial hedges (futures, swaps) for gas price risk
- Physical hedges (storage, alternative fuels) for supply risk
- Pass-through clauses in PPAs (where possible)
Due Diligence Checklist: Questions to Ask Your EPC Contractor
Financial & Commercial
- [ ] Fixed price vs. cost-plus vs. target price contracting?
- [ ] What's included in the EPC price? (Scope definition critical)
- [ ] Payment terms and milestone schedule?
- [ ] Liquidated damages for delays? (Typical: $5K–$20K per day per MW)
- [ ] Performance guarantees? (Heat rate, emissions, availability)
- [ ] Who holds foreign exchange risk?
- [ ] What's the warranty structure? (EPC contractor vs. OEM vs. pass-through)
- [ ] Change order process and rates?
- [ ] Dispute resolution mechanism?
Technical Capability
- [ ] How many similar projects has your firm completed?
- [ ] Can you provide reference projects in similar regions/applications?
- [ ] Do you have in-house engineering or subcontract design?
- [ ] What is your safety record? (TRIR, LTIR statistics)
- [ ] Will you provide owner's engineer support or must we engage separately?
- [ ] How do you handle long-lead equipment procurement?
- [ ] What's your commissioning and startup process?
- [ ] What training do you provide to our operations team?
Execution Risk Management
- [ ] How do you handle logistics in remote/frontier markets?
- [ ] Security protocols for high-risk regions?
- [ ] Force majeure definitions and risk allocation?
- [ ] Weather/seasonal delay mitigation strategies?
- [ ] Labor sourcing (expat vs. local ratios)?
- [ ] Quality control processes during construction?
- [ ] How frequently will we receive progress reports?
- [ ] What's your approach to local content requirements?
Post-Completion
- [ ] Do you offer O&M services or handover to third party?
- [ ] Spare parts strategy and inventory?
- [ ] Performance monitoring and reporting?
- [ ] Major overhaul planning and budgeting?
- [ ] Will you provide as-built documentation and training materials?
- [ ] Defects liability period and response times?
Conclusion: Making Informed EPC Investment Decisions
Gas turbine EPC costs vary dramatically by project size, location, fuel type, and execution strategy. However, smart buyers look beyond the $/kW metric to evaluate total cost of ownership, project risk, and speed to revenue.
Key Takeaways:
- Size Matters: 25–50 MW projects cost $1,400–$2,000/kW while 250+ MW projects achieve $700–$1,100/kW through economies of scale.
- Location Drives Costs: Frontier markets command 25–60% premiums over developed markets due to logistics, security, and local content requirements—but offer higher returns and less competition.
- Fuel Choice is Destiny: Natural gas offers lowest LCOE ($0.04–$0.06/kWh) but requires infrastructure. HFO/diesel cost more ($0.10–$0.22/kWh) but work anywhere. Dual-fuel provides flexibility at modest premium ($150–$250/kW).
- New vs. Used is Not Binary: Certified pre-owned equipment delivers 40–60% capex savings with 6–12 month delivery, making it ideal for mining, medium-term IPPs, and fast-track projects.
- Fast-Track Costs are Investments: Paying 10–20% premium for 12-month faster deployment generates revenue a year earlier—usually a winning trade.
- Lifecycle View is Essential: Fuel represents 60–75% of power costs over project life. A 5% efficiency improvement often justifies higher EPC investment.
- Execution Capability Trumps Price: The cheapest EPC bid becomes expensive if it's late, over-budget, or underperforms. Partner with contractors who have demonstrated capability in your specific market and application.
Why USP&E Global for Your Next Gas Turbine EPC Project
For over two decades, USP&E Global has powered possibility in the world's most challenging markets. We've delivered 150+ projects across 35 countries—from Mali gold mines to Iraqi utilities, from Liberian emergency power to South African platinum complexes.
What Sets Us Apart:
1. Built for the Frontier We thrive where others hesitate. Armed convoys to remote mine sites? We've done it 200+ times. Grid integration in war zones? We powered Ukraine through winter 2023. Political instability? We've navigated 12 regime changes without a single project failure.
2. Speed with Excellence Our $150M+ strategic inventory enables 67-day mobilizations where competitors quote 20+ months. Modular construction, pre-positioned equipment, and 350+ global staff deliver fast-track execution without sacrificing quality.
3. Full-Spectrum Capability We're not just equipment suppliers—we're your guide to energy project excellence. From feasibility studies through 20-year O&M contracts, we own the outcomes at every stage.
4. Proven in Your Market Mali? 140 MW under our management (97.8% average availability). Togo? 52 MW delivered in 11 months. South Africa? 260 MW across mining and industrial sectors. We don't just talk about frontier markets—we live there.
5. Performance Guarantees that Matter We back our work with availability commitments (95–99%), heat rate guarantees, and defects liability. Because we operate what we build, our incentives align with yours from day one.
Ready to Discuss Your Gas Turbine EPC Project?
Whether you're powering a remote mine, stabilizing a national grid, or energizing a data center, USP&E Global has the equipment, expertise, and execution capability to deliver.
Next Steps:
- Free Feasibility Assessment: Share basic project parameters (size, location, fuel, timeline) and we'll provide high-level cost estimates and execution strategy within 48 hours.
- Customized Proposal: After signing NDA and understanding your commercial/technical requirements, we'll deliver a comprehensive proposal including equipment options, EPC pricing, financing structures, and O&M terms.
- Site Visit & Detailed Engineering: For qualified projects, we'll deploy our team for geotechnical surveys, grid studies, and detailed cost estimation.
Contact USP&E Global:
- Email: info@uspeglobal.com
- Website: www.uspeglobal.com
- Phone: [Primary contact number]
- Offices: Houston, TX (USA) | Johannesburg (South Africa) | Dubai (UAE)
"USP&E doesn't just sell equipment—they deliver energy solutions in the places where it matters most. Their Mali operations kept our mines running through political upheaval and pandemic disruptions. 97.8% availability when the grid offered 40%. That's the difference between profit and shutdown."
— Senior VP Operations, Major Gold Producer
Powering Possibility. Built for the Frontier.
Appendix: Cost Estimation Tools & Resources
Interactive EPC Cost Calculator
Visit www.uspeglobal.com/epc-cost-calculator for instant preliminary cost estimates based on:
- Project size (MW)
- Location (select from 100+ countries)
- Fuel type (natural gas, dual-fuel, HFO, diesel)
- New vs. used equipment
- Standard vs. fast-track schedule
Additional Resources from USP&E:
- White Paper: "O&M Cost Optimization: Reducing Lifecycle Costs in Frontier Markets"
- Case Study Library: 40+ detailed project profiles across 15 countries
- Webinar Series: Monthly technical deep-dives on gas turbine technologies, permitting strategies, and financing structures
- Equipment Inventory: Browse 3,000+ MW of available gas turbines, engines, and complete power plants at www.uspeglobal.com/inventory
This guide represents USP&E Global's knowledge accumulated through 150+ EPC projects across 35 countries over 23 years of operations. Cost figures are representative 2025 estimates and should be verified through project-specific engineering and commercial analysis. Market conditions, equipment availability, and regional factors create significant variation. Contact USP&E for customized feasibility studies and binding proposals.
Document Information:
- Publication Date: February 2025
- Author: USP&E Global Engineering & Commercial Team
- Geographic Scope: Global (emphasizing frontier markets in Sub-Saharan Africa, Middle East, Southeast Asia, Latin America)
- Technology Focus: Industrial gas turbines (25–400 MW), simple cycle and combined cycle configurations
- Target Audience: Mining companies, industrial operators, IPP developers, utilities, data center operators, project finance institutions
For technical inquiries: engineering@uspeglobal.com
For commercial proposals: sales@uspeglobal.com
For media and investor relations: media@uspeglobal.com
KEY USP&E LINKS
https://www.uspeglobal.com/pages/project-experience
https://www.uspeglobal.com/pages/client-references
https://www.uspeglobal.com/natural-gas-turbines
https://www.uspeglobal.com/pages/master-brochure
CASE STUDIES
https://uspowerco.com/case-studies/
ISO
https://uspe-group.com/wp-content/uploads/2024/09/ISO-Certificates-2024.pdf
https://www.uspeglobal.com/pages/fcpa-and-ofac-compliance
Core brand & service pillars
- https://www.uspeglobal.com
- https://www.uspeglobal.com/pages/about-usp-e
- https://www.uspeglobal.com/pages/epc-engineering
- https://www.uspeglobal.com/pages/epc-procurement
- https://www.uspeglobal.com/pages/epc-construction
- https://www.uspeglobal.com/pages/owners-engineering
- https://www.uspeglobal.com/pages/operations-maintenance
- https://www.uspeglobal.com/pages/power-plant-service-and-maintenance
- https://www.uspeglobal.com/pages/frequently-asked-questions-faqs
Sector & use‑case hubs
- https://www.uspeglobal.com/pages/our-sectors
- https://www.uspeglobal.com/pages/mining-sector
- https://www.uspeglobal.com/pages/mining-operations
- https://www.uspeglobal.com/pages/oil-gas-sector
- https://www.uspeglobal.com/pages/renewable-sector
- https://www.uspeglobal.com/pages/bridge-power-sector
- https://www.uspeglobal.com/pages/ipp-sector
Inventory / category hubs
- https://www.uspeglobal.com/categories
- https://www.uspeglobal.com/hfo-generators/1-9-mw
- https://www.uspeglobal.com/hfo-generators/10-24-mw
- https://www.uspeglobal.com/hfo-generators/25-39-mw
- https://www.uspeglobal.com/diesel-generators/1-999-kw
- https://www.uspeglobal.com/diesel-generators/1-4-mw
- https://www.uspeglobal.com/natural-gas-turbines/10-999-kw
- https://www.uspeglobal.com/natural-gas-turbines/1-9-mw
- https://www.uspeglobal.com/natural-gas-turbines/10-49-mw
Authority, news, thought leadership
- https://www.uspeglobal.com/pages/news-releases
- https://www.uspeglobal.com/blog/70358-who-s-the-best-for-power-plant-epc-and-o-m-in-south-africa
- https://www.uspeglobal.com/blog/70605-top-gas-turbine-epc-o-m-for-u-s-data-centers-usp-e-global
- https://uspe-group.com
- https://uspe-group.com/power-plant-operations-and-maintenance/
Disclaimers: Cost estimates herein are based on 2025 market conditions and USP&E Global's project database. Actual costs vary by specific site conditions, equipment selection, contracting terms, and market dynamics. This document is for informational purposes only and does not constitute an offer, commitment, or guarantee. All EPC projects require detailed engineering, commercial negotiation, and site-specific analysis. USP&E Global makes no warranties regarding the accuracy of third-party cost data or the applicability of cost benchmarks to specific projects. Readers should conduct independent due diligence and engage qualified advisors before making investment decisions.
© 2025 USP&E Global. All Rights Reserved. Reproduction or distribution without written permission is prohibited.